Download the FitOO latest version
Download CorelPoly, preliminary work of FitOO letting you to fit polynomilas and exponential sums
FitOO is a non-linear curve fitting tool for OpenOffice.org. It is a Calc template with the necessary structure and macros to implement the Levenberg-Maquard algorithm. This algorithm resolves the underlying least squares minimization problem.
This document provides some basic information to help you use FitOO.
Of course, OpenOffice.org must be installed. FitOO was developed with OOo version 1.1 beta on a computer running Microsoft Windows. I would like some feedback on its use on other systems.
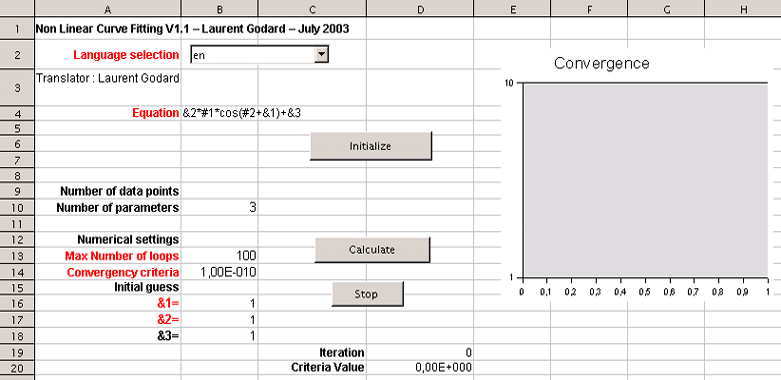
Because FitOO is implemented as a Calc template, you can directly load the file. A new document based on the template will be created. If FitOO.stc is copied to the [ooo]/user/Template directory, you can start a FitOO session using File/New/Templates... and choosing FitOO. When FitOO starts, you must allow the macros to be run. The opening screen is shown in figure 1.
A detailed description of the Levenberg-Maquard algorithm is beyond the scope of this document. This section is only a brief overview of the method.
Assume that you have observed or sampled XY data points and a general mathematical expression (an equation with a set of parameters) that is assumed to describe the data.
The goal is to calculate the parameters such that the analytical curve optimally fits the data points. This problem leads to the least squares minimization method.
With simple functions (linear, polynomials, exponentials, ...) we can analytically program the partial derivatives against each parameter and solve the problem.
More complicated functions, or combination of simpler functions, require an iterative algorithm that will minimize, step by step, the difference between the data points and the approximating mathematical expression by adjusting the parameters.

To facilitate convergence, an iterative process usually requires a reasonable initial guess.
This new 1.1 version of FitOO now handles multidimensionnal theoritical equations. Then equations as Y = F (X1...Xn;A1...Am) are now possible. This enhancement implies that the real time fitting curve is not displayed anymore. Moreover, the method to use FitOO slightly changed.
The cells in the sheets that you should modify are in red. Do not modify any other cells.
You will nedd to perform three stpeps to use FitOO :
The equation is defined inteh FitOO sheet in cell B4.
For efficiency, I did not use a calc cell to evaluate the function each time. Instead, I dynamically create a function macro, avoiding repetitive and time consuming access to the sheet.
There are two essential things to writing the mathematical expression to be optimized :
So FitOO manages equations of some dimensions face to face unknowns X.
Thus, the function given as the example &1*#1*cos(#2+&2)+&3 corresponds in fact to Y=a X1 Cos(X2+b)+c
The optimized parameters are a, b and c.
This writing allows to have thus so many parameters as we want. They were however limited to 99 what should be sufficient. Also, number of variables X is too limited to 99.
After the equation has been defined, it must be validated and working columns must be built.
This is done by clicking the Initialize button.
The associated macro calculates the number of parameters in the equation (cell FitOO:B10) and then it builds the list for the initial guess for the parameters to be optimized (Sheet FitOO, cells B16 and following).
The previous action reset the DATAS sheet and built as many columns as variables detected in the equation.
The user has now to fill these columns with data points (don't forget the Y column).
Sample data points for the example equation can be found on AA column of this sheet. You just have to copy-paste them to perform a test.
Before solving the problem, adjust the initial guess (cells B16 and following). The blue curve representing the optimized mathematical equation is updated in real-time on the « Fitted curve » chart as you modify the initial guess. This allows you to visually find reasonable initial values for parameters.
The maximum number of iterations and convergence criteria can be left as is for now (cells B13 and B14). The convergence criteria is the sum of the squared differences between the experimental XY data points and the function evaluation at those points. This is not an "objective" criteria because it depends on the value of the function at each abscissa (x) value.
When you are ready, start the iterative process by clicking on the Calculate button.
The diagram of convergence is refreshed in every iteration what can slow down the process.
The Stop button allows you to stop the iterative process when the current iteration is finished.
When designing the mathematical expression that will approximate the data, be certain to use the fewest number of parameters as possible.
For example, the function f(x)=(ax+b)/(cx+d) should be simplified to f(x)=(a'x+b')/(c'x+1) (all parameters divided by d). If you do not do this, the algorithm may oscillate between different solutions leading to a loss of convergence. The problem is the same for trigonometric functions defined modulo k.pi.
As FitOO handles as many dimensions as needed for the equation, it can be used to solve linear and non-linear systems.
The theoritical has to represent the general layout of the system equations (aX1+ bX2+cX3+d).
Then the Y column will have to be filled with 0 values.
Fitoo will then be usuable as described before.
FitOO includes a dynamic engine for translation. If you want to translate it to another language, you just have to add a new column in the "Translation" sheet and send the file to oooconv@free.fr.